Sam Reinhart Case Study
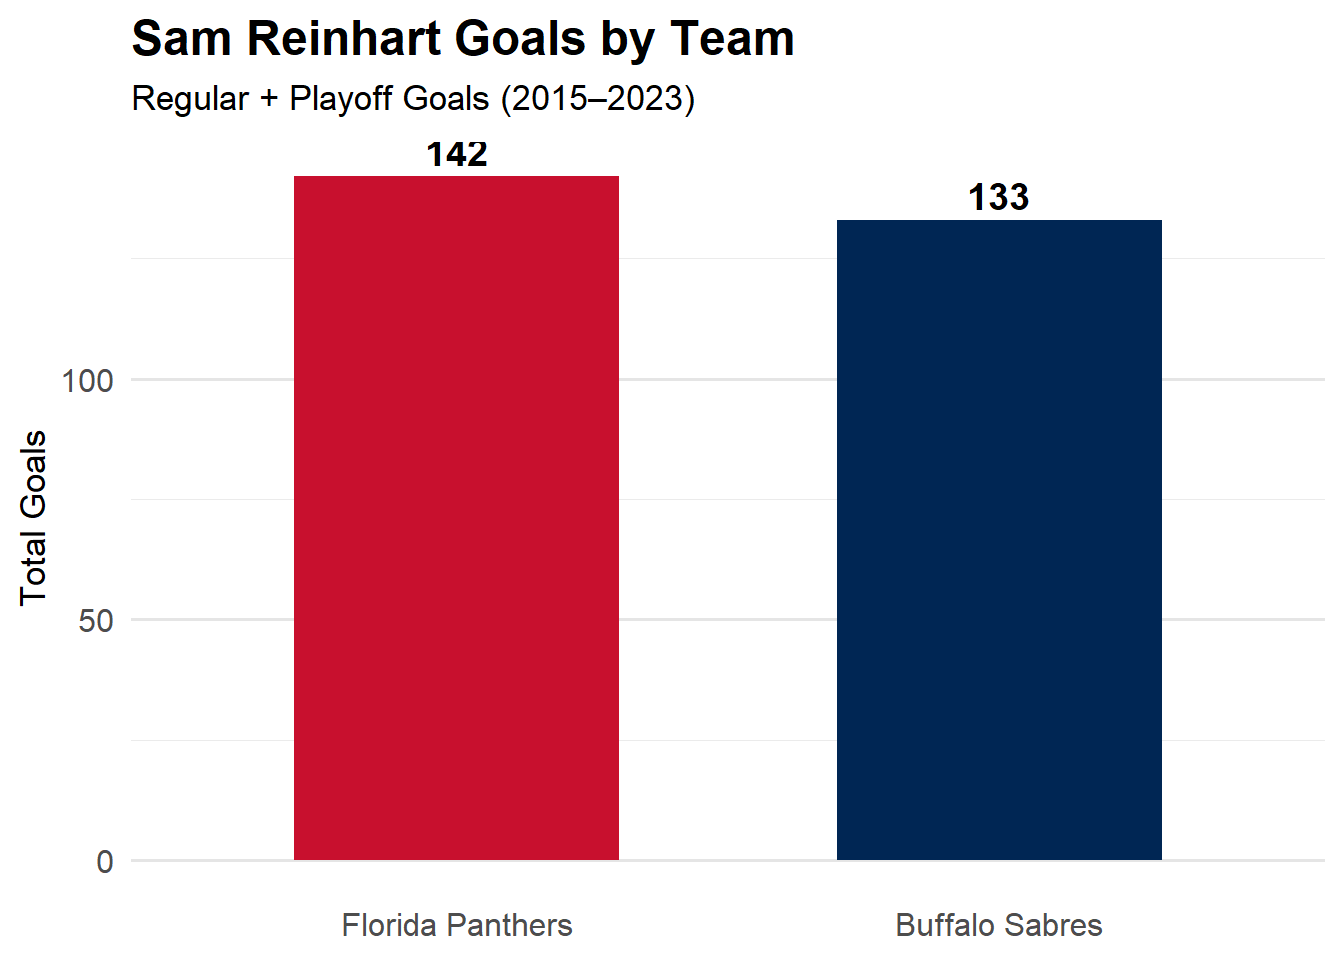
Sam Reinhart was drafted #2 overall in the 2014 draft by the Buffalo Sabres. Having played on a struggling team that never made the playoffs, Reinhart never scored more than 25 goals in his 7 seasons with the Sabres. He was then traded to the Florida Panthers where he has managed to surpass his total goals in just 4 seasons, highlighted by a career high of 57 in 2023-2024. The graph below displays the amount of goals he has scored with each franchise. It’s important to note that the dataset I utilized did not include the 50 goals he scored from this previous season, 39 in regular season and 11 in playoffs. This brings his total goal count to 192 with the Florida Panthers in just 4 seasons.
What are the reasons for this massive jump in goal scoring? Florida is obviously a better team but I wanted to take a deeper look at what factors were most important in his goals.
Logstic Regression Model for predicting the probability that a shot results in a goal based on the following factors:
\[ \log \left( \frac{P(\text{goal} = 1)}{1 - P(\text{goal} = 1)} \right) = \beta_0 + \beta_1 \times \text{shotAngle} + \beta_2 \times \text{shotDistance} + \beta_3 \times \text{shotGeneratedRebound} + \beta_4 \times \text{shotType} + \beta_5 \times \text{isPowerPlay} + \beta_6 \times \text{team} \]
The table below displays standard Logistic Regression results with all of the factors that I decided to include in the model.
| Logistic Regression Results: Predicting Reinhart’s Goals | ||||||
|---|---|---|---|---|---|---|
| Model includes shot location, type, power play, and team | ||||||
| Term | Estimate | Std. Error | Conf. Low | Conf. High | z | p |
| (Intercept) | −1.374 | 0.247 | −1.875 | −0.904 | −5.570 | 0.000 |
| shotAngle | 0.001 | 0.002 | −0.002 | 0.005 | 0.790 | 0.432 |
| shotDistance | −0.033 | 0.006 | −0.045 | −0.022 | −5.550 | 0.000 |
| shotGeneratedRebound | −15.765 | 299.605 | −138.394 | −104.611 | −0.050 | 0.958 |
| shotTypeDEFL | −0.339 | 0.387 | −1.133 | 0.397 | −0.880 | 0.381 |
| shotTypeSLAP | 0.534 | 0.359 | −0.182 | 1.232 | 1.490 | 0.137 |
| shotTypeSNAP | 0.337 | 0.280 | −0.206 | 0.895 | 1.200 | 0.229 |
| shotTypeTIP | −0.069 | 0.265 | −0.582 | 0.462 | −0.260 | 0.794 |
| shotTypeWRAP | 0.534 | 0.874 | −1.461 | 2.149 | 0.610 | 0.541 |
| shotTypeWRIST | −0.087 | 0.240 | −0.544 | 0.400 | −0.360 | 0.716 |
| isPowerPlayTRUE | 0.450 | 0.138 | 0.177 | 0.720 | 3.250 | 0.001 |
| teamSabres | −0.190 | 0.133 | −0.450 | 0.070 | −1.430 | 0.152 |
For easier data to understand, here is a modified table based on variable importance from the same model as above.
| Variable Importance: Predicting Sam Reinhart’s Goals | |
|---|---|
| From logistic regression | |
| Variable | Relative Importance |
| Shot Distance | 5.570 |
| Power Play | 3.290 |
| Team: Sabres | 1.430 |
| Shot Angle | 0.820 |
| Shot Type: DEFL | 0.680 |
| Shot Type: WRIST | 0.420 |
| Shot Type: TIP | 0.400 |
| Shot Type: BACK | 0.310 |
| Shot Type: SLAP | 0.300 |
| Shot Type: WRAP | 0.220 |
| Shot Type: SNAP | 0.080 |
| Shot Generated Rebound | 0.050 |
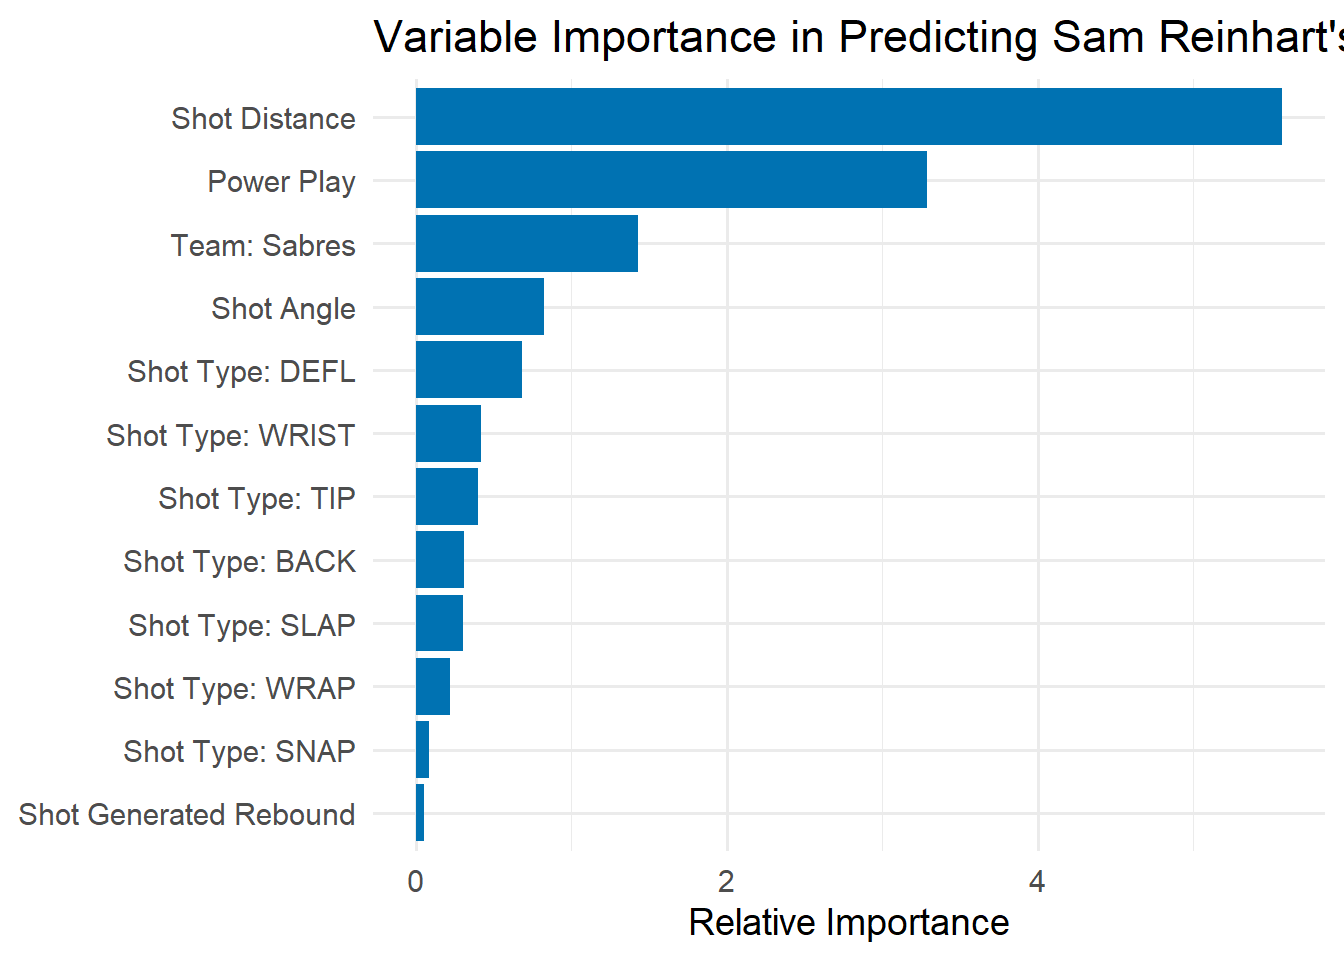
There are many takeaways from the bar chart above. The biggest and most important one is that Sam Reinhart’s massive influx in goals is due to him getting opportunities in close proximity to the net as well as powerplay opportunities, which go hand in hand. Both of those factors proved to be more impactful on his goal scoring than switching from the Sabres to the Panthers, as evidenced by the graph. Furthermore, I think the graph illustrates how important net-front skills are for forwards in today’s modern NHL game. Reinhart is not the fastest player on the ice, but he possesses elite hands and IQ around the net, which has allowed him to score so many goals with the Panthers. The graph also seems to dispel the myth in hockey that “shooting for rebounds” is a smart play. Rather, teams should focus on moving the puck to teammates in high scoring areas and execute quick shots on goal.